
Intelligent marketing reporting for business growth
Marketing reporting should indicate whether your efforts are contributing to growth. This starts with having control of the data.
By Paul Tomlinson, Published 04.02.2025
Marketing reporting should indicate whether your efforts are contributing to growth, but most companies’ reporting falls far short of this.
The majority of marketing teams report on ‘easy’ metrics such as total numbers of leads generated in that quarter, monthly site visits, or growth in a LinkedIn following. They generally do not, however, prove how their work impacted on these metrics, or how these metrics relate to marketing ROI.
If those dots are not being connected in your business, that should be regarded as a major problem. Without an effective reporting framework, the business leadership can have no confidence that their marketing investment is paying off, or that the people who make up the marketing team are earning their keep. Similarly, the marketing team will be limited in its ability to claim credit for successes, to make a business case for investment, or defend poor campaign results if they occur.
The purpose of this article is to set out the reporting best-practices that a business should expect from its marketing function.
First, we’ll discuss the importance of long-termism in marketing reporting: putting short-term fluctuations in metrics in the context of longer-term growth.
Second, we’ll explain how proving casual relationships between different metrics, however difficult, can be crucial for demonstrating marketing success and optimizing your strategy.
Finally, we’ll argue that it’s important to have full control of the data for marketing reporting. This allows you to compare data across different platforms, and produce reports that may be crucial for your business, but which the developers of your reporting software may never have thought of.
This advice is based on our collective decades of experience in delivering marketing-led growth for B2B firms – but the overall principles and best practices can be applied to any type of business. Our clients routinely discuss our reports with their boards of directors as evidence of marketing budget well-spent, and of where to allocate resources in the next quarter or year.
Many thanks to Andreas Voniatis, SEO and marketing data science expert, who contributed some valuable insights on the use of data and reporting based on his own work at Artios.
Long-term metrics are generally the most useful for marketing reporting
‘Growth’, in a business, is usually discussed in terms of years or, at minimum, quarters. Most business directors aren’t really interested in granular details such as the KPIs of an individual campaign, if your blog had more visitors in June, or if your advertising produced more sales than expected in October.
What the business leadership is interested in is whether the marketing operation they’re funding had a meaningful impact on company revenues in that quarter or year. They’re interested in whether their marketing expenditure was too high or too low, and whether rebalancing that outlay could have an impact on profitability – and if so, over what timeframe.
You should consider, therefore, whether the metrics you’re reporting are most useful on a short-term timeframe (i.e., monthly), or given as month-on-month / year-on-year metrics.
An obvious place to do this is with your website traffic, which generally fluctuates seasonally. For example: here’s a chart showing monthly traffic to a client website managed by Navigate B2B. Viewing this metric in isolation, we might have celebrated a great month in March and then wondered what went wrong the rest of the year.

…but when we lay this over data from other years, we can see that the seasonal trajectory was actually pretty normal. March 2023, it turns out, was nothing to be excited about whereas October 2024 arguably was.

More interestingly, we can see that the company website received record or equal-record levels of traffic in 6 out of 12 months in 2024 and finished the year on a high. That’s a genuinely useful and credible sign of marketing-led growth.
You can then use this data to inform further analysis and decision-making. For the same client shown above, we used this data to optimize our PPC budget, lowering it in quiet months to reduce wastage, and increasing it at times of peak activity to increase competitiveness in the market.
So, you can see the usefulness of being able to put short-term peaks and troughs in the context of longer-term trends.
This is hard to do with out-of-the-box reporting dashboards, which default to showing data from standalone fixed time periods. They may allow you to select days, weeks, calendar months, years, etc., but not give you any indication as to whether the data is a natural seasonal variation, a marketing success (or failure), or an anomaly worthy of further investigation.
Also, many marketing efforts take time to pay off.
In the early days of a new marketing initiative, you might see metrics double or triple each month – but this could equally represent a low benchmark as much as a marketing success.
This chart is a good example. In October, the large number of new positions in Google search would appear to indicate an SEO triumph. By December, however it’s apparent that really the August/September figures were extremely poor, and the trajectory suggests that even better results might come in Q1.

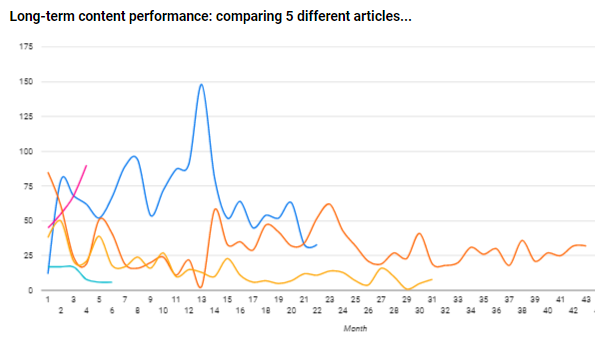
This is especially true with thought leadership-based inbound marketing. This content should deliver increasing ROI over time as the business creates and then builds on an audience base.
Illustratively: this chart compares five different blog posts we’ve published to a client website over the past few years, and it shows how misleading short-term data can be. Orange, yellow and blue all had very similar second months with 50-80 views, but delivered radically different long-term ROI as they fared differently in Google search.
Of course, your optimal reporting timescales are subjective to both the business and the campaigning channel.
Particularly in consumer marketing, you may need real-time data on an advertising campaign which may only last a few weeks or months, and produces a fairly rapid and short-lived impact on sales. The length of a B2B sales funnel, meanwhile, can easily run into years – so for a marketing initiative launched this year, you may not even be in a position to calculate ROI until 24+ months later.
The real point here is that failing to take a long view of the data makes it almost impossible to interpret shorter-term peaks and troughs, and tie the marketing efforts back to growth.
Proving cause and effect between marketing initiatives and metrics
Proving causation is fundamental to marketing reporting: being able to say with certainty that a specific campaign, or a specific change in expenditure, had a specific impact on the business.
But as Andreas Voniatis comments…
‘Something I find that SEOs are not very good at, or marketers in general… they’re not very good at explaining whether the change was seasonal or down to something that they did.’
The quickest way to identify possible causal relationships between statistics is via apparent correlations. For instance, if your social media analytics spike in the same month as your website traffic, the social media team may want to claim that as proof of marketing success.
But correlations can be misleading.
Back in 2014, a Harvard University student called Tyler Vigen drew attention to this problem with ‘Spurious Correlations,’ a satirical project that plots similar but completely unrelated datasets against each other. Here’s one example; since about 2006, Baidu’s stock price has fluctuated more or less in-line with Saturn’s distance from the Sun.

Clearly, you can’t say peaks and troughs are interrelated simply because they produce similarly-shaped curves.
Such apparent correlations are, however, good reasons to investigate a possible causal relationship and look for proof – which you can also find in other datasets.
Let’s say you want to check whether some search engine optimisation (SEO) efforts had paid off. An increase in site traffic could be a good sign – but, Andreas says…
“If there is no change in Google rank position despite increased traffic, the change may simply be a busier time for your market… most likely, your competitors have also experienced an uptick in clicks.”
The way to check this would be to introduce some separate data on your Google rank positions and other competitive SEO metrics. You can usually get this information from popular SEO tools such as Conductor or Moz, which aren’t perfect, but which do give a good broad indicator of SEO performance for many websites.
From experience, a whole range of non-marketing factors can influence your site traffic. The CEO might have featured in the press but forgotten to tell the marketing team; the sales team may have been on a big outbound push that month; the economy may have gone up or down in a given market.
The point is that proving a marketing success or failure often includes disproving possible causes, as well as proving them, to be certain of your findings.
And sometimes, the unexpected happens.
One of the most useful findings we made in our client reporting, at Navigate B2B, was that the personal LinkedIn activity of a CEO can have a major influence on site traffic.
This was discovered as the result of some detective work when we noticed website users acquired as direct traffic had been climbing surprisingly quickly in 2022-2023. You can see this in the pale blue line on this chart.

Initially, we assumed this trend was sales-led (i.e., more people seeking out the client’s website as a result of outreach activity and word-of-mouth referrals).
But after a while, we noticed that the lift in direct site traffic started around the same time that we increased usage of the client’s personal LinkedIn profile as a marketing tool. Sure enough, across about 1,000 datapoints across all three companies, we found that a spike in social media impressions was associated with a 2:1 probability of a spike on the website.
This seemed an unlikely causal relationship, because we had two long-held assumptions:
- that this would have been recorded in Google Analytics (GA) as user acquisition from social media – usually a fairly minor traffic source
- that LinkedIn users were more or less just clicking around the social media environment, and would rarely visit your website without a link or a call to action (CTA).
As it turned out, both assumptions turned out to be incorrect.
We discovered this by bringing in data from two other clients to whom we provided similar services, and found equivalent correlations across 1,000 datapoints. This was enough data to prove of a causal relationship, which was useful, because it meant we could allocate more resources to social media marketing with an expectation of ROI.
Such associations can be highly valuable for showing how marketing metrics relate to general business growth.
A good example is this chart plotting the increase in searches for generic products, sold by a client of Artios, compared to searches for the client’s branded product.
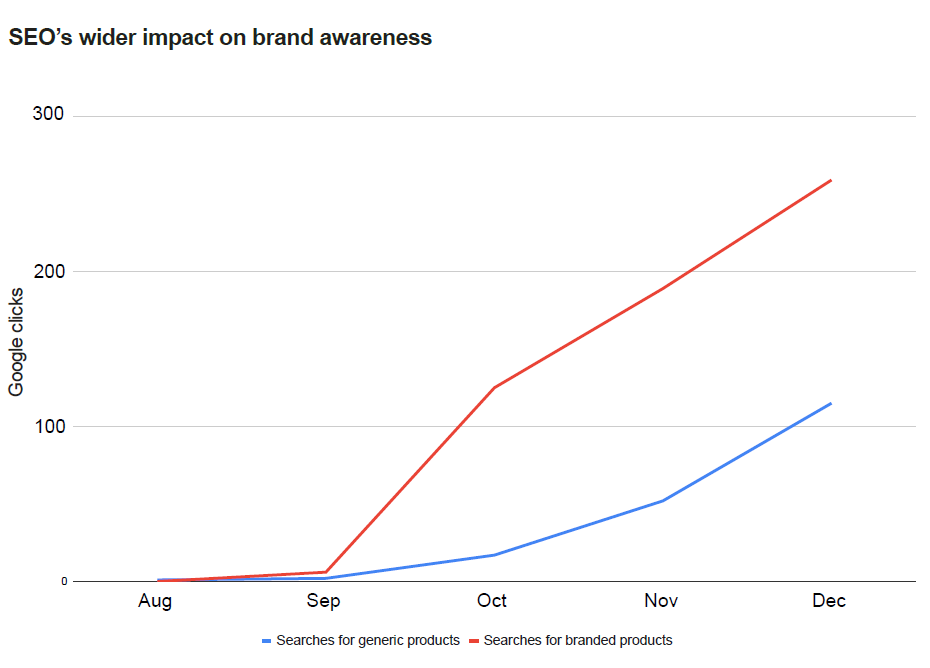
Whilst the increased search volume is positive, the increased volume for the branded product is even more so, because it shows that people are already thinking of the brand before their search begins. That would indicate marketing-led growth above and beyond SEO.
*
This is where automated reporting dashboards, and crude monthly measures of headline metrics, really show their limitations.
Granted: they can display neatly-presented data which may be a useful starting point for further investigation. But they probably won’t indicate causal relationships between disparate channels and campaigns.
Tracking technologies, such as browser cookies and UTM tags (custom URLs which can be detected by Google) can help, but peoples’ devices and browsers increasingly block such tracking, so it’s never 100% accurate. If the unexpected happens – if part of the audience journey takes place offline, or if one initiative has ripple effects on other marketing KPIs – it will very likely take human detective work to connect the dots.
That, in turn, requires having complete control of the data.
Useful marketing reporting depends on control of the data
Marketers, in their defence, are not helped much by the available software on the market for reporting and analytics. To do truly effective reporting, therefore, you need to pull raw data from different platforms and into a separate environment where the marketer has full control.
The limitations of third-party reporting software
Practically every marketing tool has some kind of analytics capability, so for most marketers, their ‘reporting stack’ might include some mix of GA4, social media analytics, CRM/automation analytics, and advertising analytics. This is a lot of data to consider, so the company may also licence a SaaS dashboard such as Whatagraph, or the dashboard buried with in a wider software suite such as Monday.com or Jira, to pull all those disparate pieces of data into once place.
There are various problems with all these systems. One is that they might make pretty graphs, but aren’t particularly useful for business decision-making. Andreas comments…
“A lot of the people writing software for reporting are not statisticians, they’re not data science-trained. So they’ll make a lot of clunky visualisations, which can be quite dangerous and misleading.”
Moreover, like all software, reporting tools are ‘opinionated’ – i.e., designed based on a third-party technology company’s expectation of how an average client might work. Of course, ‘average’ only exists in theory, so in practice, nearly every business will find standard reporting tools lacking in some way.
For a few common examples:
- GA4 doesn’t offer the calendar month as a standard reporting period
- LinkedIn wipes any data older than one year, so you can’t report on year-on-year (YoY) trends unless you capture and save the data elsewhere
- in HubSpot, the level of reporting control you get is subject to your subscription tier
…and every tool will have its limitations. The only truly robust reporting setup, therefore, is to expose native analytics, from your various platforms and tools, in single place where the marketing team can use it as they see fit.
Human detective work makes marketing reporting more useful
The intended uses of this data would include planning, negotiation and interaction with the rest of the business.
This chart from Artios is a good example. On the surface, it shows a client’s SEO performance, broken down by different search terms. But it’s also useful for demonstrating that these scores fluctuate – sometimes significantly. This can be useful for setting clients’ or employers’ expectations about what ‘good’ performance might look like, and across what time periods.

Sometimes, the data you’ll want to report on may not even be available in any standard tools or systems.
For one Navigate B2B client, we noticed that some articles on their blog were performing better than others, and wanted to understand and investigate why.
We theorised that several factors might be at play:
- the length of an article
- the number of third-party references – as an analogue for the level of research that went into the blog
- the number of outbound links – as a minor SEO factor which might make the blog more useful to people researching a topic
…and as it turned out, that the only really strong correlation was between the length of the article, and the number of people reading it several months or years later.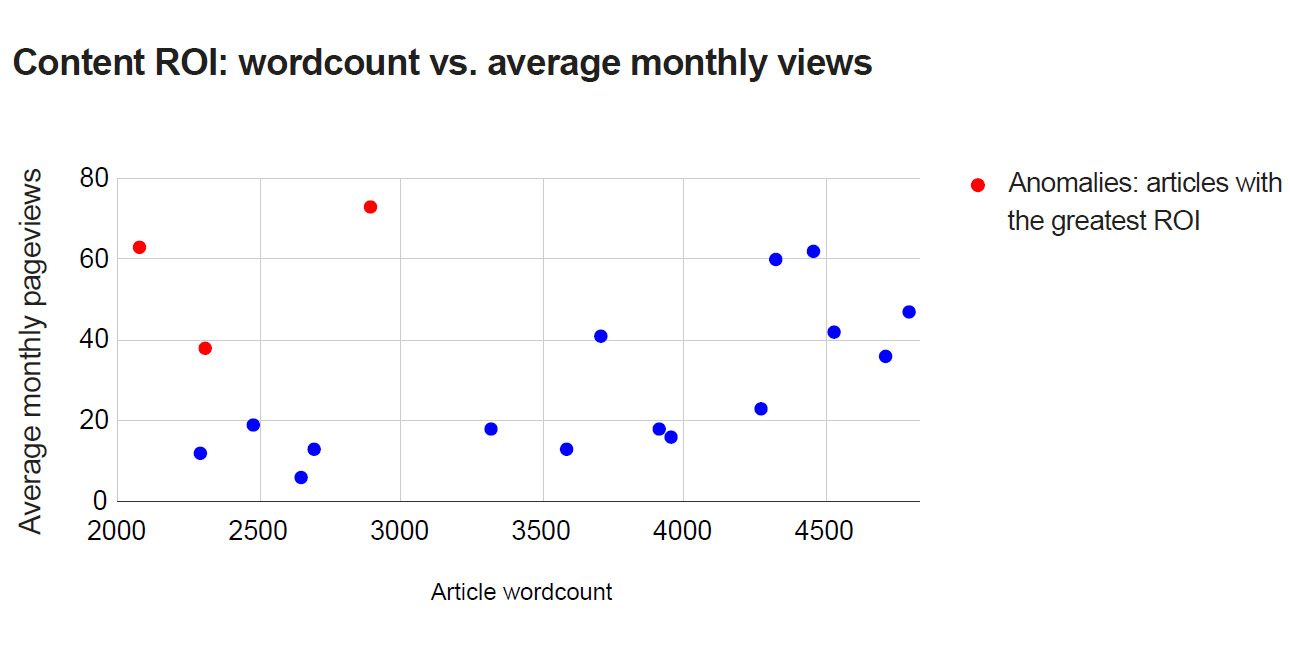
With the anomalies removed, we established that a 3,000 to 4,500-word article is likely to produce over 50% more organic users, long-term, than 2,000 to 3,000-word article.
Even more interesting, though, was the anomalies.
Some articles produced outsized performance regardless of their length – and really, these were the successes we wanted to replicate.
After considering various possible factors, we determined that:
- the most successful articles all based on broad, strategic topics
- …whilst the less-successful articles were more likely to be opinion-pieces and/or with a niche focus.
In some cases, the long-term difference in performance might have been 5-10x.
You’d never have identified this trend with reporting dashboards, because they simply aren’t designed for it; after all, ‘word count’ and ‘topic’ are not marketing KPIs.
Yet at the time, this was the single most useful reporting insight we’d produced for that client. It fed into future content planning efforts, and determined where to allocate marketing resources.
*
We should be clear that this article is not a tirade against technology-enabled reporting. Any reports you pull regularly can and should be automated, and tech should be used to process larger volumes of data more quickly than might otherwise be possible. Artios, for example, uses Python to mode large-scale SEO changes to client websites.
But whilst tech can contribute to the story, it can’t tell the story. As Andreas comments, a lot of marketing consultants…
‘…spend loads of time doing what a computer can be doing, instead of exercising their curiosity.’
Done well, marketing reporting a hybrid discipline comprising data analytics, account management/internal politics, and whatever marketing or creative work you’re reporting on.
It’s also, fundamentally, about communication between colleagues. As a human process, it depends on detective work, driven by human curiosity, guided by the businesses strategic objectives and geared towards growth.
You simply can’t expect a dashboard to pick up the slack here. If you neglect this work, as a marketer, you inevitably limit your ability to drive growth for the business.
5 core components an effective marketing reporting framework
As discussed, the ‘right’ reporting setup will vary from business to business, so we’re not going to tell you what metrics to report on, or which tech to use to pull organise your data; this is mostly subjective.
There are, however, best-practices for marketing reporting, which we’d argue are common to every business regardless of its size, industry or the makeup of its martech stack.
1. Engage the wider business in your reporting
The audience for your reports should be your client, or your senior leadership team, so you should agree with those people which metrics are useful to the business.
At larger companies, some useful data may be owned by other marketing teams, such as the CRM team or the social media team – and as we’ve discussed, marketing in one channel might impact on metrics in another. So, you should also build alliances across the business and share data so that everyone has the information they need at their fingertips.
2. Have control of the data
Out-of-the-box analytics dashboards – whether buried in a platform or standalone SaaS – can help your reporting, but they can’t tell the full story. You need access to the raw data to prove the marketing impact across disconnected marketing channels and audience touchpoints, and to report on things that are of unique importance to your business, or your marketing team.
3. Automate the grunt-work
There is (almost) no excuse for manual data entry in this day and age. You should be able to automate the most commonly-used reports in your business using low-cost data tools for joining up different systems.
This is highly achievable for non-technical professionals. With very little training, you can use tools such as Fivetran and Matillion to push and pull data between platforms and databases and achieve a joined-up view of all your marketing, with only minor ongoing maintenance.
4. Focus on long-term growth
Short-term reporting can be useful for monitoring the performance of ongoing campaigns but this is likely to be of more internal value for the marketing team.
In our experience, the occasional peak or trough is rarely anything to get excited or worried about. More likely, factors beyond your control, such as audience behaviour and/or the time of year, can produce cause short-term fluctuations in the metrics.
Long-term growth over years is what businesses are really interested in, so that should really be the major focus of your reporting.
5. Report at regular intervals, and don’t under-invest
Reporting is easy to neglect; there’s always going to be an urgent campaign to launch, some creative work that’s overdue or some meetings that feel more urgent.
The truth is that reporting is amongst the most useful marketing there is, as it tells you whether you’re working effectively, and how to improve. As soon as you lose sight of the data, you lose the ability to claim your successes or defend your budget.
Anything less than quarterly reporting probably isn’t enough for most businesses. Marketers themselves should at least be watching the major KPIs monthly – because 3 months is too long to wait to find out if your initiatives are on the right track.
About the authors
 Paul Tomlinson is the founder of Navigate B2B, a content agency specialising in niche value propositions and high-quality thought leadership. We build long-term patnerships with commercial leaders and company founders to support sales cycles and with inbound and outbound campaigning. Find out more at NavigateB2B.com.
 Andreas Voniatis is the founder of Artios, provider of SEO services to startups, SMEs and enterprise. Artios uses technology to model large-scale changes to clients’ site content, guaranteeing 200% growth based on improved search traffic. Andreas is also the author of Data-Driven SEO. To found out more, visit Artios.io.